### What changes were proposed in this pull request?
https://github.com/apache/spark/pull/32015 added a way to run benchmarks much more easily in the same GitHub Actions build. This PR updates the benchmark results by using the way.
**NOTE** that looks like GitHub Actions use four types of CPU given my observations:
- Intel(R) Xeon(R) Platinum 8171M CPU 2.60GHz
- Intel(R) Xeon(R) CPU E5-2673 v4 2.30GHz
- Intel(R) Xeon(R) CPU E5-2673 v3 2.40GHz
- Intel(R) Xeon(R) Platinum 8272CL CPU 2.60GHz
Given my quick research, seems like they perform roughly similarly:
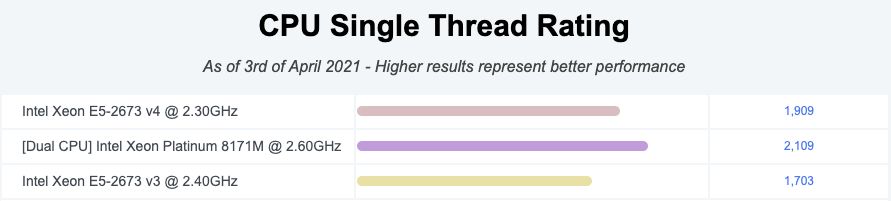
I couldn't find enough information about Intel(R) Xeon(R) Platinum 8272CL CPU 2.60GHz but the performance seems roughly similar given the numbers.
So shouldn't be a big deal especially given that this way is much easier, encourages contributors to run more and guarantee the same number of cores and same memory with the same softwares.
### Why are the changes needed?
To have a base line of the benchmarks accordingly.
### Does this PR introduce _any_ user-facing change?
No, dev-only.
### How was this patch tested?
It was generated from:
- [Run benchmarks: * (JDK 11)](https://github.com/HyukjinKwon/spark/actions/runs/713575465)
- [Run benchmarks: * (JDK 8)](https://github.com/HyukjinKwon/spark/actions/runs/713154337)
Closes#32044 from HyukjinKwon/SPARK-34950.
Authored-by: HyukjinKwon <gurwls223@apache.org>
Signed-off-by: Max Gekk <max.gekk@gmail.com>
First, a bit of background on the code being changed. The current code tracks
metric updates for each task, recording which metrics the task is monitoring
and the last update value.
Once a SQL execution finishes, then the metrics for all the stages are
aggregated, by building a list with all (metric ID, value) pairs collected
for all tasks in the stages related to the execution, then grouping by metric
ID, and then calculating the values shown in the UI.
That is full of inefficiencies:
- in normal operation, all tasks will be tracking and updating the same
metrics. So recording the metric IDs per task is wasteful.
- tracking by task means we might be double-counting values if you have
speculative tasks (as a comment in the code mentions).
- creating a list of (metric ID, value) is extremely inefficient, because now
you have a huge map in memory storing boxed versions of the metric IDs and
values.
- same thing for the aggregation part, where now a Seq is built with the values
for each metric ID.
The end result is that for large queries, this code can become both really
slow, thus affecting the processing of events, and memory hungry.
The updated code changes the approach to the following:
- stages track metrics by their ID; this means the stage tracking code
naturally groups values, making aggregation later simpler.
- each metric ID being tracked uses a long array matching the number of
partitions of the stage; this means that it's cheap to update the value of
the metric once a task ends.
- when aggregating, custom code just concatenates the arrays corresponding to
the matching metric IDs; this is cheaper than the previous, boxing-heavy
approach.
The end result is that the listener uses about half as much memory as before
for tracking metrics, since it doesn't need to track metric IDs per task.
I captured heap dumps with the old and the new code during metric aggregation
in the listener, for an execution with 3 stages, 100k tasks per stage, 50
metrics updated per task. The dumps contained just reachable memory - so data
kept by the listener plus the variables in the aggregateMetrics() method.
With the old code, the thread doing aggregation references >1G of memory - and
that does not include temporary data created by the "groupBy" transformation
(for which the intermediate state is not referenced in the aggregation method).
The same thread with the new code references ~250M of memory. The old code uses
about ~250M to track all the metric values for that execution, while the new
code uses about ~130M. (Note the per-thread numbers include the amount used to
track the metrics - so, e.g., in the old case, aggregation was referencing
about ~750M of temporary data.)
I'm also including a small benchmark (based on the Benchmark class) so that we
can measure how much changes to this code affect performance. The benchmark
contains some extra code to measure things the normal Benchmark class does not,
given that the code under test does not really map that well to the
expectations of that class.
Running with the old code (I removed results that don't make much
sense for this benchmark):
```
[info] Java HotSpot(TM) 64-Bit Server VM 1.8.0_181-b13 on Linux 4.15.0-66-generic
[info] Intel(R) Core(TM) i7-6820HQ CPU 2.70GHz
[info] metrics aggregation (50 metrics, 100k tasks per stage): Best Time(ms) Avg Time(ms)
[info] --------------------------------------------------------------------------------------
[info] 1 stage(s) 2113 2118
[info] 2 stage(s) 4172 4392
[info] 3 stage(s) 7755 8460
[info]
[info] Stage Count Stage Proc. Time Aggreg. Time
[info] 1 614 1187
[info] 2 620 2480
[info] 3 718 5069
```
With the new code:
```
[info] Java HotSpot(TM) 64-Bit Server VM 1.8.0_181-b13 on Linux 4.15.0-66-generic
[info] Intel(R) Core(TM) i7-6820HQ CPU 2.70GHz
[info] metrics aggregation (50 metrics, 100k tasks per stage): Best Time(ms) Avg Time(ms)
[info] --------------------------------------------------------------------------------------
[info] 1 stage(s) 727 886
[info] 2 stage(s) 1722 1983
[info] 3 stage(s) 2752 3013
[info]
[info] Stage Count Stage Proc. Time Aggreg. Time
[info] 1 408 177
[info] 2 389 423
[info] 3 372 660
```
So the new code is faster than the old when processing task events, and about
an order of maginute faster when aggregating metrics.
Note this still leaves room for improvement; for example, using the above
measurements, 600ms is still a huge amount of time to spend in an event
handler. But I'll leave further enhancements for a separate change.
Tested with benchmarking code + existing unit tests.
Closes#26218 from vanzin/SPARK-29562.
Authored-by: Marcelo Vanzin <vanzin@cloudera.com>
Signed-off-by: Dongjoon Hyun <dhyun@apple.com>