## What changes were proposed in this pull request? Add user guide and scala/java/python examples for `ml.stat.Summarizer` ## How was this patch tested? Doc generated snapshot:  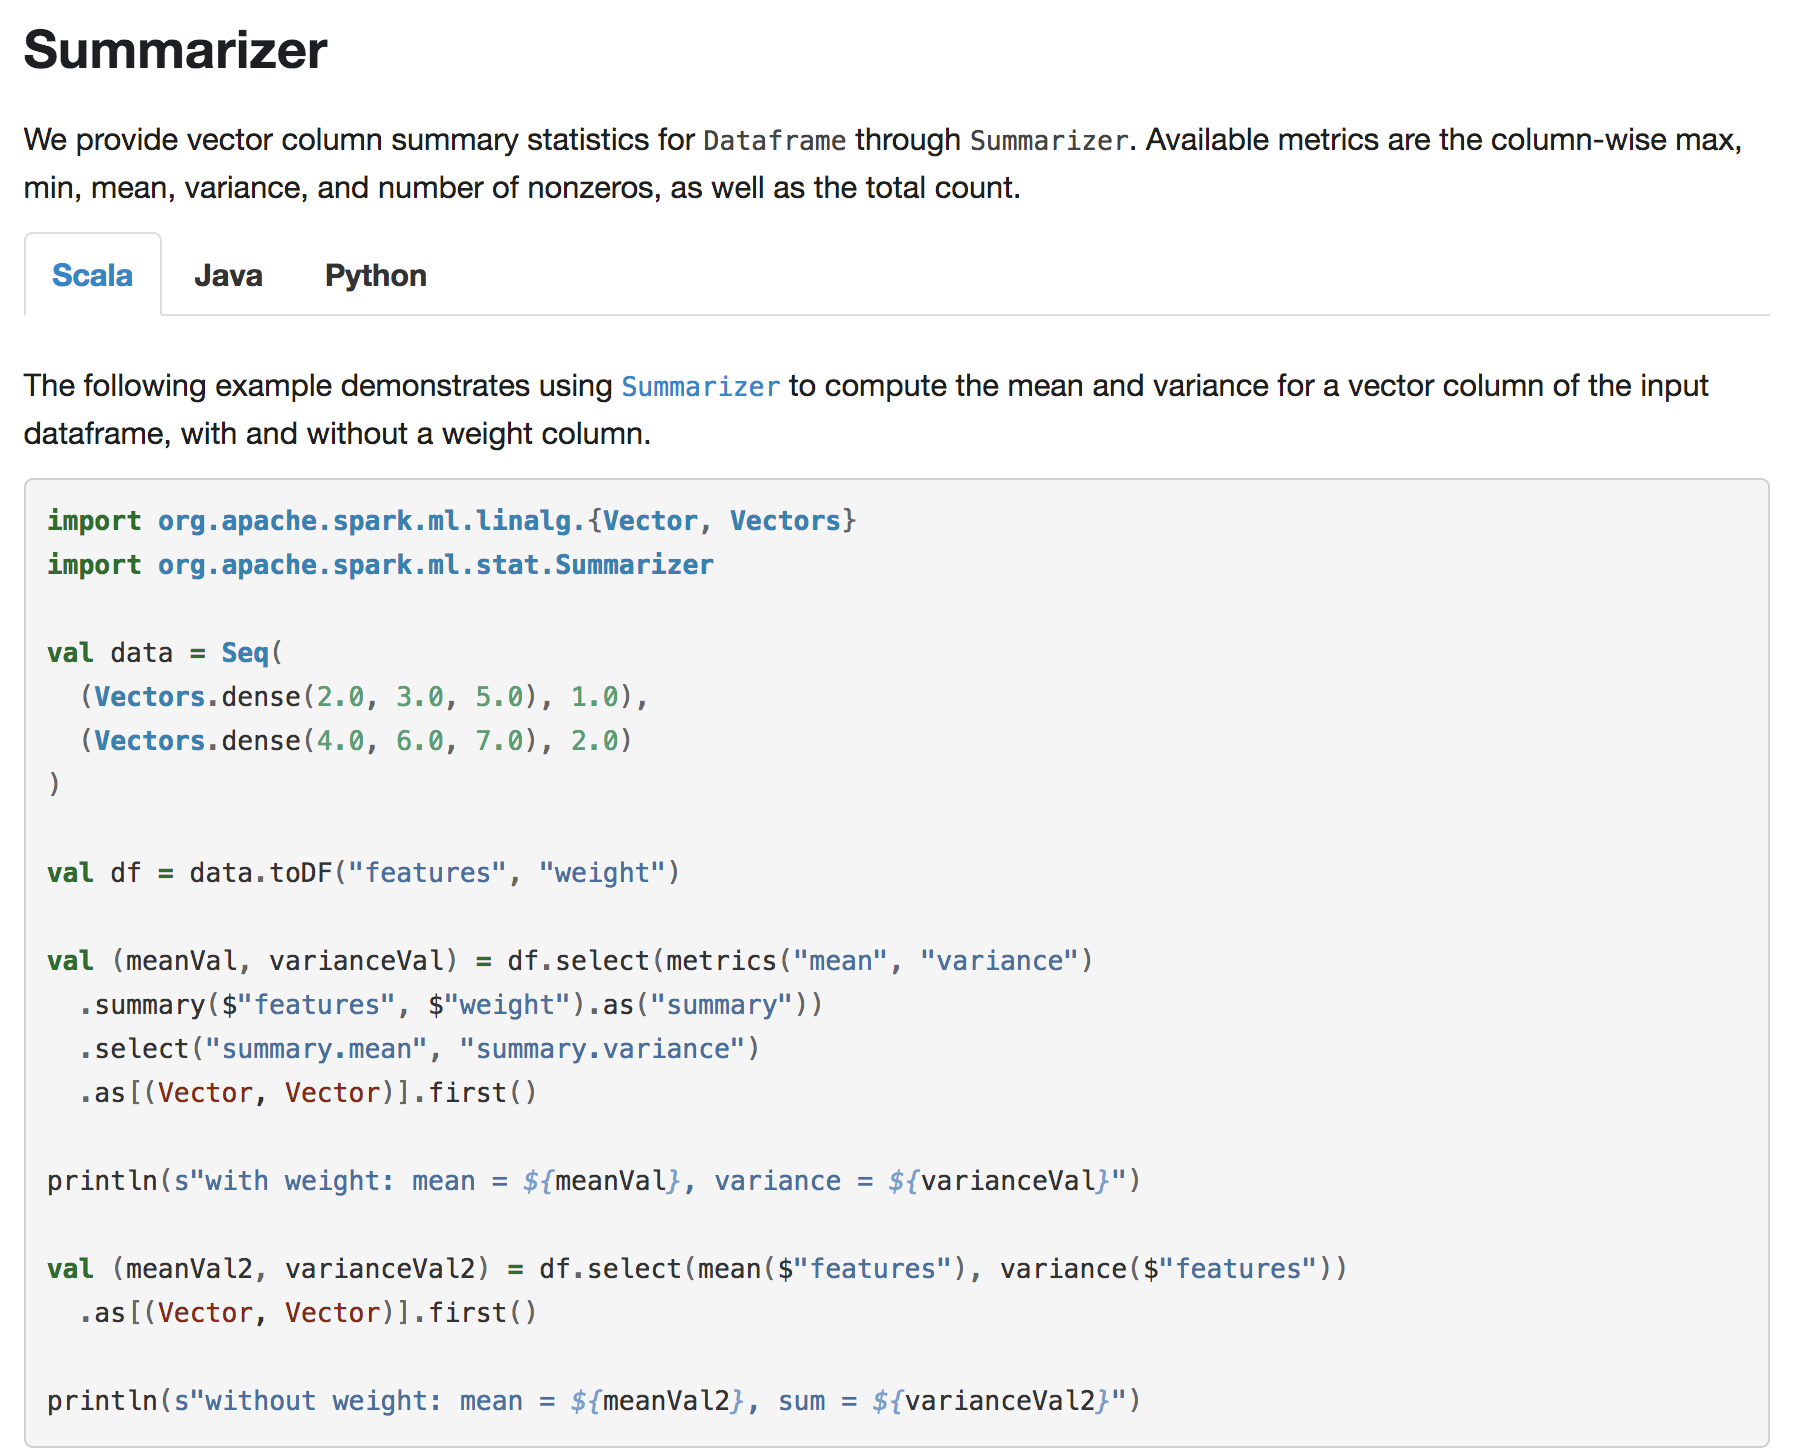   Author: WeichenXu <weichen.xu@databricks.com> Closes #20446 from WeichenXu123/summ_guide.
4.4 KiB
| layout | title | displayTitle |
|---|---|---|
| global | Basic Statistics | Basic Statistics |
\[ \newcommand{\R}{\mathbb{R}} \newcommand{\E}{\mathbb{E}} \newcommand{\x}{\mathbf{x}} \newcommand{\y}{\mathbf{y}} \newcommand{\wv}{\mathbf{w}} \newcommand{\av}{\mathbf{\alpha}} \newcommand{\bv}{\mathbf{b}} \newcommand{\N}{\mathbb{N}} \newcommand{\id}{\mathbf{I}} \newcommand{\ind}{\mathbf{1}} \newcommand{\0}{\mathbf{0}} \newcommand{\unit}{\mathbf{e}} \newcommand{\one}{\mathbf{1}} \newcommand{\zero}{\mathbf{0}} \]
Table of Contents
- This will become a table of contents (this text will be scraped). {:toc}
Correlation
Calculating the correlation between two series of data is a common operation in Statistics. In spark.ml
we provide the flexibility to calculate pairwise correlations among many series. The supported
correlation methods are currently Pearson's and Spearman's correlation.
{% include_example scala/org/apache/spark/examples/ml/CorrelationExample.scala %}
{% include_example java/org/apache/spark/examples/ml/JavaCorrelationExample.java %}
{% include_example python/ml/correlation_example.py %}
Hypothesis testing
Hypothesis testing is a powerful tool in statistics to determine whether a result is statistically
significant, whether this result occurred by chance or not. spark.ml currently supports Pearson's
Chi-squared ( $\chi^2$) tests for independence.
ChiSquareTest conducts Pearson's independence test for every feature against the label.
For each feature, the (feature, label) pairs are converted into a contingency matrix for which
the Chi-squared statistic is computed. All label and feature values must be categorical.
{% include_example scala/org/apache/spark/examples/ml/ChiSquareTestExample.scala %}
{% include_example java/org/apache/spark/examples/ml/JavaChiSquareTestExample.java %}
{% include_example python/ml/chi_square_test_example.py %}
Summarizer
We provide vector column summary statistics for Dataframe through Summarizer.
Available metrics are the column-wise max, min, mean, variance, and number of nonzeros, as well as the total count.
{% include_example scala/org/apache/spark/examples/ml/SummarizerExample.scala %}
{% include_example java/org/apache/spark/examples/ml/JavaSummarizerExample.java %}
{% include_example python/ml/summarizer_example.py %}